The Legal Culture, vol. 1, no. 1, 2018, pp. 114 - 130
DOI: 10.37873/legal.2018.1.1.14
Economic value of domestic work
Katalin Szép
Abstrakt / Abstract
The article analyses the economic value of domestic work, following the logic of the statistical examination: describing the phenomena and their appropriate measures, defining the terminology and fitting it into the existing system of statistical concepts. The author draws attention to important sources of data and indicates the methods of their measurement.Then the data sources are looked for and the methods developed. The results are illustrated with the Household Satellite Account of Hungary with some European perspectives.
Artykuł analizuje wartość gospodarczą pracy domowej, zgodnie z logiką pracy statystycznej: opisuje zjawiska i stosowne do nich miary, definiuje terminologię i wprowadza ją do istniejącego systemu pojęć statystycznych. Następnie Autor zwraca uwagę na istotne dane statystyczne dotyczące wartości pracy domowej i wskazuje metody pomiaru tych danych. Rezultaty są zilustrowane rachunkiem narodowym gospodarstw domowych Węgier ukazanym w europejskiej perspektywie
Słowa kluczowe: praca w gospodarstwie domowym, wartość ekonomiczna, gospodarstwo domowe, statystyka
Keywords: domestic work, economic value, household, statistics
INTRODUCTION
Generally speaking, as private persons we are aware that domestic work plays an important role in the life of families. The role of domestic work in societies, its contribution to the economic wellbeing and to the whole economy is not broadly known.
The statistical measurement can help to raise the awareness of the domestic work, it can improve the dignity of this labour and engender respect for the workers who do it. Statistics on the volume and value of domestic work provide relevant information for family policy.
Based on the results of the time use survey, the population living in private households spent roughly the same or more time on unpaid domestic work as on “productive work” that is included in the national accounts. The inclusion of services produced with unpaid work would mean a considerably higher value in the consumption of households. This is considerable in the performance of the national economy, too. The “extended” production, which is calculated taking into account the performance of unpaid work, resulted in a 22-47% higher GDP value for 2010.The percentage depends on the evaluation metfhod used.
This paper follows the logic of the statistical examination: describing the phenomena and their appropriate measures, defining the terminology and fitting it into the existing system of statistical concepts. Then the data sources are looked for and the methods developed. The results are illustrated with the Household Satellite Account of Hungary with some European perspectives. Two examples are presented using the economic value of household production.
The Hungarian Household Satellite Account was compiled by the team of Timea Cseh, Magdolna Komolafe, Klaudia Máténé Bella, Csilla Sebők, Katalin Szépwith the contribution of other experts from different departments of the Hungarian Central Statistical Office
PHENOMENA
The common understanding of household constitutes the starting point. “A household is either an individual person or a group of persons who live together under the same housing arrangement and who combine to provide themselves with food and possibly other essentials of living.” The common elements of the slightly different household definitions are that household is an economic unit, a housekeeping unit, based on sharing income, tools, time and consumption.
Figure 1. SIMPLE HOUSEHOLD MODEL
|
Utility
|

|
|
Market goods
|
|
|
|
|
|
|
Money income
|
Source: Homan, The allocation of time and money.
The simple model (Figure 1.) considers household as a consumer unit with the household member using his or her time to earn money on the market. Then the consumer uses this money income and chooses a set of goods yielding maximum utility, given the budget constraint. The message of this model is: more money income, more market goods bought – better life. Some improvement can be achieved, if leisure time admitted to contribute to utility, adding it as argument to utility function. But we all know, that washing powder – like most of the products - bought on the market, does not provide utility by itself, we need to add some work, use washing machine to obtain clean clothes, which yields utility. This activity is reflected in Becker’s household production model.
Figure 2. HOUSEHOLD PRODUCTION MODEL
|
Utility
|
|
|
|
Production of household commodities
|
|
|
|
Market goods
|
|
|
|
|
|
|
Money income
|
Source: Homan, The allocation of time and money.
In the household production model (Figure 2.) the household has a consumer function plus production function, it is seen as a small firm. It purchases market goods and combines them with time in the household production process to produce commodities yielding utility. Let’s see an example. A Sunday lunch is a commodity providing utility. There are several possibilities to achieve it. One can buy meat and vegetables on the market and process them with a lot of work, or buy washed vegetables or pre-processed food and add less work, or even go to the restaurant nearby. Thus, it is clear that there is a substitution possibility between market goods and domestic work. One can consider also sharing the working time between the market, and non-market (domestic) work comparing the income lost and the value of household production.
The household is a production unit – producing goods and services –, but these products and services are intended for own consumption, they do not enter the market – hence do not have price, and the work is not paid. Household production contributes to the economic welfare of households. Household production is part of a country’s economic performance. In macroeconomics, being aware of the substitution possibility with the market production, if the household production is disregarded/omitted, the performance of a country will be underestimated, the comparison of countries will be biased by its different size in different countries; the dynamic measured will be biased related to the changes in share of household and market production.
Nowadays, we experience an emerging need to measure household production. Recent analysis and programmes - beyond the usual macroeconomic indicators like GDP - urge the more complete presentation of households’ aspects and distribution of income, consumption and wealth.
CONCEPTS
The generally accepted concept of household production is based on the so called „third party criterion”, as Margaret Reid wrote: “Household production consists of those unpaid activities which are carried on, by and for the members, which activities might be replaced by market goods or paid services, if circumstances such as income, market conditions and personal inclinations permit the service being delegated to someone outside the household group.”
The question is: this concept, does it fit into the existing system of concepts, like production, income and work?
The household production meets the criteria of general production as laid down in the national accounts handbook: „Production is an activity carried out under the control, responsibility and management of an institutional unit that uses inputs of labour, capital and goods and services to produce outputs of goods and services. …”
The household production is a source of household income as set out in the resolution on standards for household income statistics, adopted by the International Conference of Labour Statisticians (ICLS): „Household income may be defined to cover: (i) income from employment (both paid and self-employment); (ii) property income; (iii) income from the production of household services for own consumption; and (iv) current transfers received.”
The activity performing household production meets the criteria of work, as laid down in the resolution ICLS concerning statistics of work, employment and labour underutilisation:
“… 6. Work comprises any activity performed by persons of any sex and age to produce goods or to provide services for use by others or for own use. (a) Work is defined irrespective of its formal or informal character or the legality of the activity. (b) Work excludes activities that do not involve producing goods or services (e.g. begging and stealing), self-care (e.g. personal grooming and hygiene) and activities that cannot be performed by another person on one’s own behalf (e.g. sleeping, learning and activities for own recreation). (c) The concept of work is aligned with the General production boundary as defined in the System of National Accounts 2008 (2008 SNA ) and its concept of economic unit that distinguishes between: (i) market units (i.e. corporations, quasi-corporations and household unincorporated market enterprises 2); (ii) non-market units (i.e. government and non-profit institutions serving households); and (iii) households that produce goods or services for own final use. (d) Work can be performed in any kind of economic unit.”
As cited above, relevant standard concepts on production, income and work already exist, but in each case, they are completed with an operational concept, which excludes household production, mainly due to measurement problems.
The national accounts are a consistent system of macro-economic accounts. The system of national accounts provides a comprehensive picture about the production, the generation and distribution of incomes, furthermore, expenditure and consumption. The GDP is probably the most known indicator from this system. Concerning households, the general production concept covers households’ market and non-market production as well (Figure 3.). The actual – operational - production boundary of national accounts, covers all the production for the market. From the non-market production, it includes the production of goods, own construction of houses, (capital formation), volunteer work resulting in goods. From the services, only the housing services of own-occupier (imputed rent) are included. All the other services for own use or for others,such as volunteering, are excluded.
All the work performed in non-market production is unpaid. The result of unpaid work producing services outside the national accounts boundaries is not measured in statistics, remains invisible – in this sense too – it is an invisible work.
Figure 3. PRODUCTION BOUNDARY OF NATIONAL ACCOUNTS
|
GENERAL PRODUCTION
|
|
ESA PRDUCTION
|
Market production
• Goods
• Services
|
• Goods
- Production of goods for use
- Gross capital formation
- Volunteer work resulting in goods
• Services
- Housing services for owner occupier
- Own account production of services
- Informal help to other households
- Volunteer work resulting in services
|
|
Consequently, we cannot obtain a comprehensive picture of household production from national accounts. In the following part, we focus on the household production in the meaning of non-market production of households. Being aware of measurement specialities satellite accounts are a tool to cover the gap between the general and national accounts’ production boundary.
Household satellite accounts have the goal to cover the whole of non-market household production. The sum of ESA and non-ESA production is considered as the total extended production. We have to measure household production outside the actual boundaries using the principles and methods of national accounts, as a basis permitting to be integrated innational accounts. In Europe, thereis asoft recommendation of the framework, describing alternative solutions compiled by Eurostat in 2003.
MEASUREMENT, RESULTS
The estimation process is applied to the production not covered by national accounts. We used the input method, like most European countries. In this case, we built up the output value from inputs (Figure 4.).
value of labour
(time valued at suitable wage)
|
|
+ other taxes on production
|
|
- other subsidies on production
|
|
+ consumption of capital
|
|
= gross value added
|
|
+ intermediate consumption
|
|
+= value of total output
|
Source: Eurostat. Household production. 2003
. p. 12.
The first item is the value of work input, where the number of hours is valued with a certain hourly wage. The taxes related to household production are taxes on ownership of assets utilised in production, e.g. motor vehicle tax. Subsidies on production are those received, if performing such activities e.g. child care allowance obtained under the condition that access to employment and placement of children in kindergarten are restricted. The consumption of capital consists of the loss of value in the durables used for production, like kitchen utensils, washing machines. This item is estimated with the PIM model based on stock and expected lifetime of these. The sum of the items listed gives the gross value added, corresponding to GDP contribution. Intermediate consumption consists of market goods and services used for production, like potatoes for cooking, washing powder for cleaning clothes. This way we obtain the estimation of the value of total output of household production.
The value of labour is a key item in this estimation process, worth to highlight some details. The reliability of data on working time is a key issue. A few minutes could be felt as centuries when sitting in the chair of a dentist. Vice versa, time can go fast when chatting with friends. We can trust the data only, if all the activities are recorded during 24 hours. The time allocation can be different by seasons and by days of the week. In the time use survey (TUS) persons in the sample report on their activities performed during the 24 hours of the selected day. The sample of days is representative to the whole year. Activity, the starting time, duration are recorded, as well as where, for whom, with whom, paid or not, primary or secondary activity and others are recorded for 24 hours in the time use diary. In addition, characteristics of persons in the sample and of their households are collected as well. The time use survey is expensive, carried out generally with a 10-year interval. It is rich source of information on the population’s activities. In our case, we have to separate household production from other activities, like paid work, leisure or learning. We consider only the data on primary activities.Comparable time use data are available from the Eurostat webpage.
Figure 4. TIME SPENT ON PAID/UNPAID FORMS OF WORK IN EUROPEAN COUNTRIES
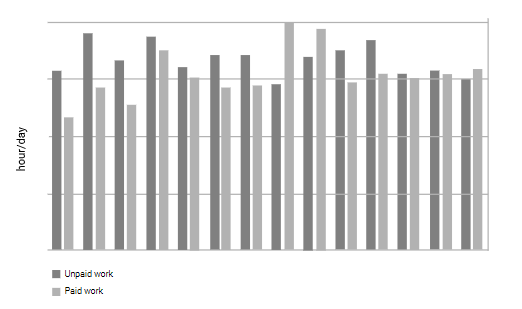 Source: Eurostat, HETUS, collection round 2000 [tus_00npaywork]
Figure 5. shows the average hours/day of 12 months’ period devoted to paid and unpaid work of the population 20 to 74 years old, living in private households in 14 European countries. The magnitude of unpaid work is similar to paid work, in most countries even higher.
In Hungary, the situation is similar, with the population aged 15-84 allocating more time to unpaid household and voluntary work outside the National Accounts boundaries than to the work (mainly paid) devoted to the production covered by National Accounts (NA). In the following analysis, we focus on household production outside NA boundaries. A very high percentage, 95,9% of this work is devoted to serve the needs of own household, nearly 4% is an informal help for other households, and the measured voluntary work for or through institutions is very limited. Concerning the breakdown of the time allocated for own household by aims, the half of time is designated to provide food, nearly one fourth to housing, 19% on care of children and adults in need.
Figure 5. STRUCTURE OF THE TIME ALLOCATED FOR (OWN)
HOUSEHOLD PRODUCTION IN HUNGARY
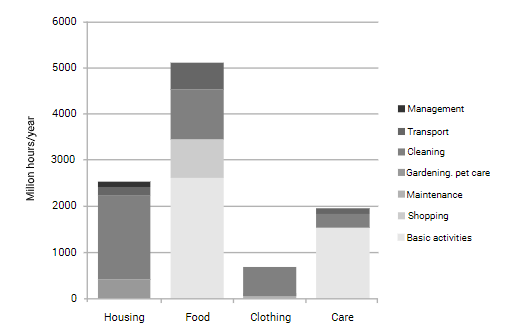 Source: HCSO Time Use Survey 2009-2010. Population of age 15-84. HSA
In providing housing, the basic activity is own dwelling construction, yet, as it is included in NA, it is absent here. The major activity is cleaning, maintenance and small repairs is the second. In the column representing the time allocated for food, preparing food (basic activity) forms the largest part, but washing up (cleaning) is not negligible either. Shopping for food is a regular activity that requires more time than any other shopping. Time allocated to clothing is not significant, and nearly all of it is spent on washing. The time allocated to taking care of children and adults in need requires some comments. For the purpose of the household satellite account, we used only the primary activities. Parallel secondary activities are ignored. Moreover, time spent when a child is sleeping or playing nearby at home – albeit being a passive form of childcare – is not included here either.
Having the number of working hours in household production we need hourly wages to assess its value. There is no overall agreement on the wage to be used. The different options are presented in Figure 7.
|
|
|
|
Replacement cost
|
|
|
|
Opportunity cost
|
|
|
|
Wages of specialized workers in market enterprises (e.g. cook)
|
|
|
|
Wages of generalist workers (domestic employees)
|
|
|
|
Wages on the market of the given person performing the task
|
|
|
|
We can start from the substitution criteria of household production. What price the household would have to pay in case of hiring someone to perform the required task (replacement cost)? Here we have two possibilities. An option is to use the hourly wage of a housekeeper, like a general substitute, who can perform almost all the tasks. The other option is to use the hourly wage of specialised workers in the corresponding occupation e.g. cook, nurse, driver – like special substitutes.
One could start from the person’s decision, when sharing his/her time between market and household work: What would one earn, if the time spent on unpaid work were spent on paid work? In this case we should use the hourly wage in the paid work of the given personas an opportunity cost. The opportunity cost could be relevant for microeconomic aspects, but is not supported in macroeconomics.
In each of these cases there are three options: net and gross wages, or gross wages +social security paid by employers. This means 3x3, altogether 9 versions.
When compiling the Hungarian household satellite account, we considered the net wage of special substitutes in the most convenient manner. This is the wage level of a skilled worker – since special knowledge of local needs and environmental conditions are needed in addition to skills in the given activity. The decisions required here can be identified with the competence of medium-level leaders. Net because no taxes are paid, implies neither pensions nor sick-pay. Beyond this version, the other 8 versions (altogether 9 versions) were calculated to see the effect in the results. Wage data sources were the survey on individual wages and salaries with the reference year of 2010. This is an annual survey of the Employment and Social Office in Hungary, which is representative to businesses (>5 employees) and public institutions.
The production account based on the scheme of Figure 4., using the net wage of special substitute is presented in Table 1.
Table 1. PRODUCTION ACCOUNT OF HOUSEHOLD PRODUCTION NOT COVERED BY NATIONAL ACCOUNTS IN HUNGARY, 2010.BILION HUF
|
Denomination
|
Housing
|
Food
|
Clothing
|
Care
|
Voluntary
work
|
Total
|
|
Value of worka)
|
1525
|
3099
|
341
|
1518
|
14
|
6497
|
|
Taxes (+) and subsidies (–) on production
|
12
|
2
|
|
-96
|
|
-81
|
|
Net value added
|
1538
|
3101
|
341
|
1423
|
14
|
6416
|
|
Consuptionsumption of fixed capital
|
175
|
168
|
31
|
46
|
0
|
420
|
|
Gross value added
|
1713
|
3269
|
372
|
1468
|
14
|
6836
|
|
Intermediate consumption
|
369
|
1196
|
123
|
235
|
0
|
1924
|
|
Output
|
2082
|
4465
|
495
|
1704
|
14
|
8759
|
|
Capital formation
|
158
|
164
|
25
|
38
|
0
|
386
|
a) Usingnet wage of special substitute
Source: KSH Hungarian Central Statistical Office. Value of domestic work and household satellite account in Hungary
The distribution of value added by aims is slightly different from the one of time allocation due to the wage differences of occupations. Household production not included in the national accounts belong to services in its nature. This is reflected by its labour-intensive character, i.e. 74% of the estimated value of its output (8759 billion HUF) comes from the value of labour input (6497 billion HUF).
To judge the magnitude of household production in the national economy, it is interesting to compare it to the GDP. Integrating the gross value added calculated with the core national accounts, would result with a significantly higher GDP (Figure 8.).
Figure 7. GROSS VALUE ADDED OF HOUSEHOLD PRODUCTION NOT COVERED BY NATIONAL ACCOUNTS IN HUNGARY, 2010
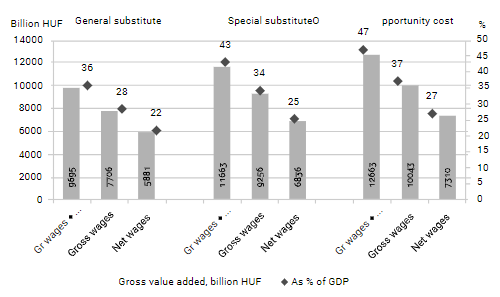 Source: KSH Hungarian Central Statistical Office. Value of domestic work and household satellite account in Hungary
The results are differing according to the different method of valuating theworking time, ranging from 22% up to 47% (the dots show the percentages relative to GDP), not surprisingly as household production is labour intensive. With the net wages of special substitutes, as we deemed suitable, GDP would be 25% higher. The household production is related primarily to the household sector. Compiling the set of accounts, the results appear to provide 37% higher adjusted disposable income of households. The increase is a virtual income accounted from household production, the labour value of the services they produced for themselves.
Going beyond the Hungarian case, let’s have a brief international outlook. The inclusion of household perspective is on the table of statisticians since the 70-ties, related to the national accounts development. We can find recommendations on household satellite accounts in SNA at UN level, in ESA at European level. A comprehensive proposal was developed by a task force, published in 2003 by Eurostat. Actually, in Europe there is a work undertaken regarding the development and harmonisation of TUS, and generally linking household statistics to national accounts. Recently, the Conference of European Statisticians has discussed the Guide on valuing unpaid household service work , prepared by a UNECE task force. In Europe, more and more countries publish Household Satellite Accounts , recently Poland in 2015. But the results are not comparable as a result of the lack of common agreement mainly on the valuation method and wages. The OECD published an experimental study on the estimation of the value of non-market services in households of27 countries. The study aimed at improving the comparability of material well-being with the inclusion of household production. According to their results, the value of household production has a magnitude of 20 to 50 % of GDP in these countries.
USE
One application of the economic value of household production is the extension of National Transfer Accounts with the time allocation. It is about inter-age transfers. The lifecycle deficit is defined simply as the difference between consumption and labour income at a given lifecycle stage.
Figure 7. CUMULATIVE EFFECTS OF VARIOUS CHANNELS OF INTER-AGE RESOURCE REALLOCATIONS, HUNGARY, 2000
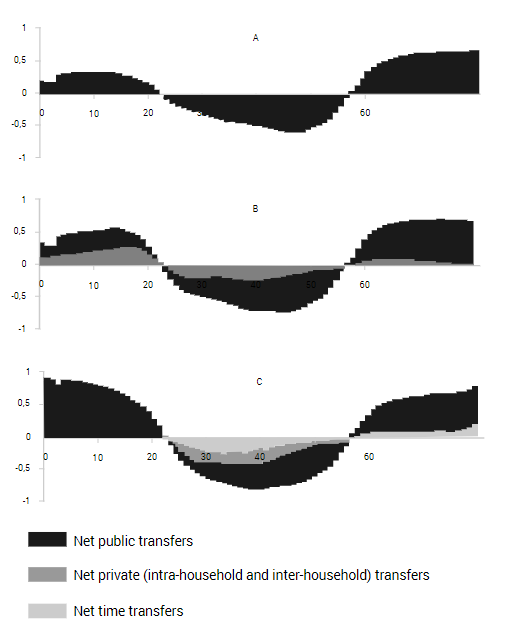 Notes: Values are normalised on the per capita labour income of persons aged 30-49.Source: Gál R, Szabó E, VarghaL.“The age-profile of invisible transfers.”
On figure A, the black area represents the public transfers received minus the contribution to public resources in different ages. Public transfers are financed mostly by people in their active age, and consumed uniformly. In childhood, the balance is positive (e.g. consumption of education, public healthcare), while in active age people’s contribution to public sources is higher than consumption. Finally, in old age the balance is again positive mainly due to social security and public healthcare. Socialisation leaves traces that can be captured bypublic statistics. On figure B, private cash transfers within households are added (grey area), what parents spend from their income on the consumption performed by their children. With the help of household satellite accounts, we value the domestic work, it can be summarised. The Figure C shows what happens, if we include the time transfers. Parents bear the lion’s share of the cost of raising their own children - in cash and time, both directly and in terms of opportunities foregone. The authors have received similar results analysing 10 European countries. European societies, as societies, transfer more resources on average to each child than to each older person. (Yet, to the extent that children subsequently become productive tax and social security paying adults, they create positive externalities that benefit all of the society.) Children in Europe may receive nearly half of their net transfers in the form of unpaid household labour.
The analysis of the time use during the great recession can be considered as another application. In case of economic crisis do individuals allocate their foregone market production to home production? How the allocation of time evolves over the business cycle? Based on the annual American Time Use Survey data in the period 2003 – 2010, these questions could be investigated. Mark Aguiar et al. presented the shift of tendency in the market and non-market working time. During recession, in average 30% of foregone market work hours were reallocated to nonmarket work and in addition plus 5% to childcare according their assessment. They found significant differences by family status, single personsreallocated only 15% while married people 42%.
CONCLUSIONS
Production performed by households for own consumption is an integral part of material well being, as is widely accepted by economists and sociologists.
Some key methods of statistical measurement are in place and prove that the amount and the value of non-paid work are significant. Further development is needed to achieve international comparability and to produce these estimates on a more systematic basis.
High quality time use data are available at national level in most European countries. As in TUS, we have detailed information on persons and their household/family in the sample high variety of breakdown can be analysed. Household satellite accounts are available in some countries. As they are based on time use data, these are a rich source for deep analysis of different society segments, as the available variables enhance the detailed breakdown by gender, age, education, household categories and others. An immediate possibility is the wider use of these sources.
Bibliografia
-
Aguiar M., Hurst E., Karabarbounis L., Time Use During Great Recession, „American Economic Review” 2013, vol. 103 (5), p. 1664–1696, https://www.aeaweb.org/articles?id=10.1257/aer.103.5.1664, accessed: 1 Nov. 2017.
-
Ahmad N., Seung-Hee K., Incorporating Estimates of Household Production of Non-Market Services into International Comparisons of Material Well-Being, „OECD Statistics Working Papers”, no. 2011/07, OECD Publishing, Paris, http://dx.doi.org/10.1787/5kg3h0jgk87g-en, accessed: 1 Nov. 2017. DOI: https://doi.org/10.1787/5kg3h0jgk87g-en
-
Becker G., A theory of the allocation of time, „The Economic Journal”, September 1965. DOI: https://doi.org/10.2307/2228949
-
Commission of the European Communities, GDP and beyond. Measuring progress in a changing world, Communication from the Commission to the Council and the European Parliament, Brussels, 20.8.2009, COM(2009) 433 final, http://eur-lex.europa.eu/LexUriServ/LexUriServ.do?uri=COM:2009:0433:FIN:EN:PDF, accessed: 1 Nov. 2017.
-
onference of European Statisticians, Sixty-fifth plenary session, Geneva, 19–21 June 2017, https://www.unece.org/fileadmin/DAM/stats/documents/ece/ces/2017/CES_6-Guide_on_Unpaid_Household_Work_for_endorsement.pdf.
-
European Commission and IMF and OECD and UN and World Bank, System of National Accounts 2008, SNA 2008, New York 2009, edition.http://ec.europa.eu/eurostat/ramon/statmanuals/files/SNA2008.pdf, accessed: 1 Nov. 2017.
-
Eurostat, European System of Accounts. ESA 2010, Luxembourg: Publications Office of the European Union, 2013, http://ec.europa.eu/eurostat/documents/3859598/5925693/KS-02-13-269-EN.PDF, accessed: 1 Nov. 2017.
-
Eurostat, GDP and Beyond, Overview of related actions and publications, http://ec.europa.eu/eurostat/web/gdp-and-beyond/overview, accessed: 1 Nov. 2017.
-
Eurostat, Household Production and Consumption. Proposal for a Methodology of Household Satellite Accounts, 2003 Edition Working studies, 2003, ISSN 1725-065X ISBN 92-894-6049-0, http://ec.europa.eu/eurostat/ramon/statmanuals/files/KS-CC-03-003-EN.pdf, accessed: 1 Nov. 2017.
-
Gál R.I., Szabó E., Vargha L., The age-profile of invisible transfers: The true size of asymmetry in inter-age reallocations, „Journal of the Economics of Ageing” vol. 5, 2015, http://www.sciencedirect.com/science/article/pii/S2212828X14000346, accessed: 1 Nov. 2017. DOI: https://doi.org/10.1016/j.jeoa.2014.09.010
-
Gál R.I., Vanhuysse P., Vargha L., Pro-Elderly Welfare States within Child-Oriented Societies, Under publication in „Journal of European Public Policy”, 2017. DOI: https://doi.org/10.2139/ssrn.2979171
-
Homan M., The Allocation of Time and Money in One-earner and Two-earner Families; An Economic Analysis, PhD thesis, Erasmus University, Rotterdam 1988.
-
ICLS, Resolution concerning household income and expenditure statistics, October 2003, http://www.ilo.org/global/statistics-and-databases/standards-and-guidelines/resolutions-adopted-by-international-conferences-of-labour-statisticians/WCMS_087503/lang--en/index.htm, accessed: 1 Nov. 2017.
-
ICLS, Resolution concerning statistics of work, employment and labour underutilization, adopted by the Nineteenth International Conference of Labour Statisticians, October 2013, http://www.ilo.org/global/statistics-and-databases/standards-and-guidelines/resolutions-adopted-by-international-conferences-of-labour-statisticians/WCMS_230304/lang--en/index.htm, accessed: 1 Nov. 2017.
-
KSH Hungarian Central Statistical Office, Value of domestic work and household satellite account in Hungary, Statistical reflections, 21 December 2016, http://www.ksh.hu/apps/shop.kiadvany?p_kiadvany_id=501891&p_temakor_kod=KSH&p_session_id=746862757654014&p_lang=EN, accessed: 1 Nov. 2017.
-
OECD, OECD Framework for Statistics on the Distribution of Household Income, Consumption and Wealth, OECD Publishing, Paris 2013, p. 15, http://dx.doi.org/10.1787/9789264194830-en, accessed: 1 Nov. 2017. DOI: https://doi.org/10.1787/9789264194830-en
-
Reid M.G., Economics of Household Production, J. Wiley & Sons, 1934, https://archive.org/stream/economicsofhouse00reid#page/10/mode/2up, accessed: 1 Nov. 2017.
-
Stiglitz J.E., Sen A., Fitoussi J.-P., Report by the Commission on the Measurement of Economic Performance and Social Progress, http://www.insee.fr/fr/publications-et-services/dossiers_web/stiglitz/doc-commission/RAPPORT_anglais.pdf, accessed: 1 Nov. 2017.


